> ## Documentation Index
> Fetch the complete documentation index at: https://trainings.air.athelas.com/llms.txt
> Use this file to discover all available pages before exploring further.
# Review your KPI Dashboard
Analyze key statistics to monitor and evaluate your practice’s operational efficiency, patient outcomes, and financial performance.
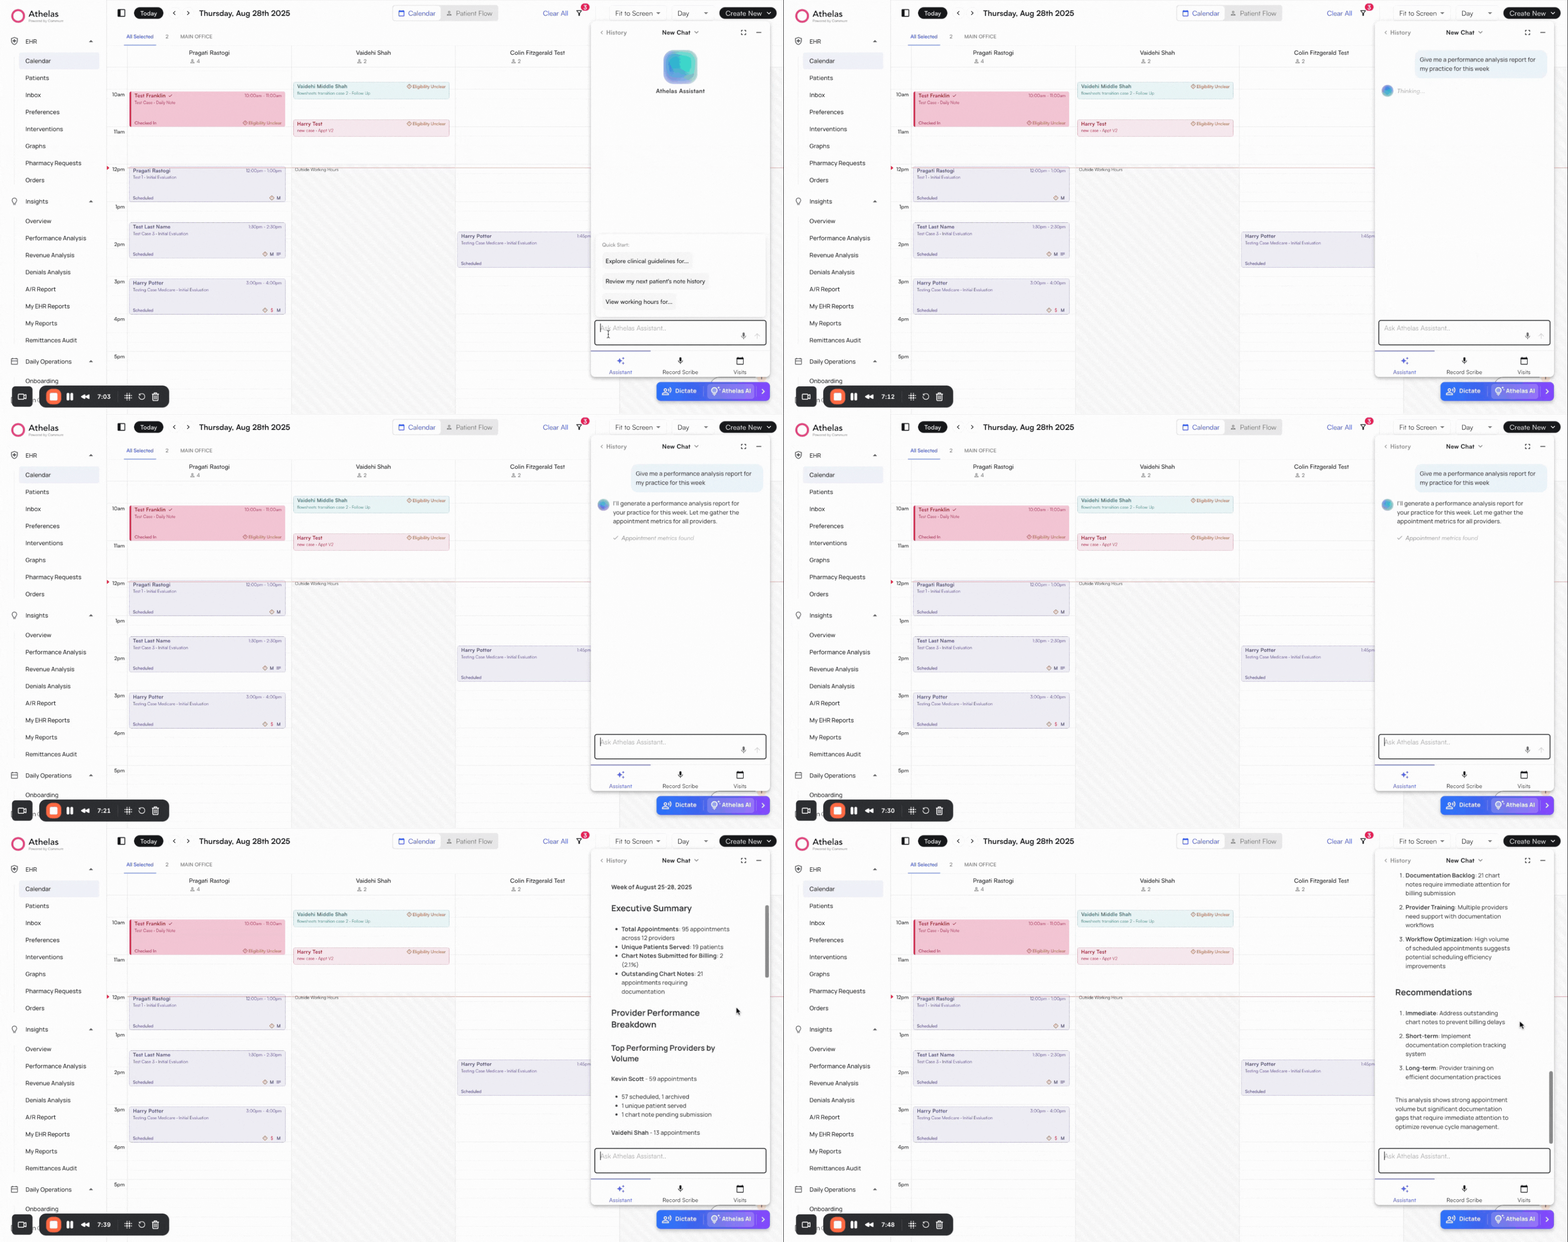
### **Ask Athelas AI for quick statistics**
✨**Smart Tip:** Use Athelas AI to generate quick reports and surface key statistics instantly. You can also use Voice Mode.
 ### **Review detailed reports**
Access a full overview of KPIs in **Insights → Performance Analysis** on the left navigation bar.
### **Review detailed reports**
Access a full overview of KPIs in **Insights → Performance Analysis** on the left navigation bar.
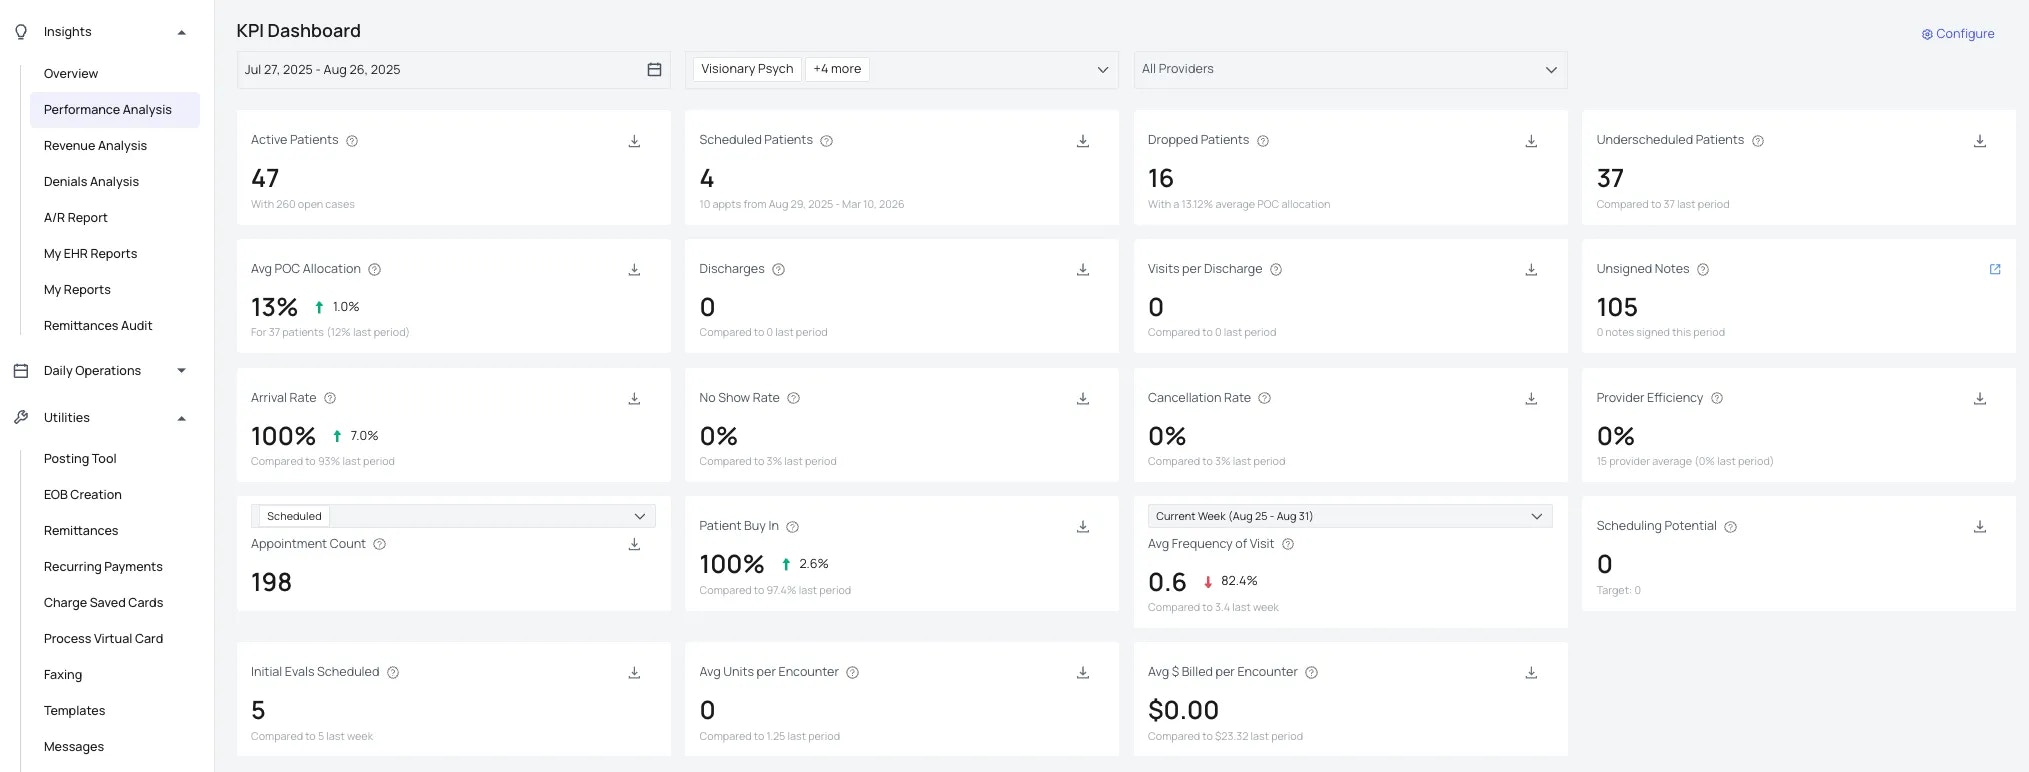 * **Definitions:** Hover over the info icon on any card to see a definition of the metric.
* **Filters:** Apply filters by Date Range, Facility, and Provider. Most cards, tables, and downloads respect these filters
* Exceptions include Active, Scheduled, and Dropped Patients (which are based on case status rather than date).
* Appointment Total cards include their own dropdown filters, allowing you to quickly view appointment metrics by status.
* **Trends:** Each card highlights current values with a “last period” comparison to indicate positive or negative changes. *“Last Period”* refers to the previous interval equal to the selected date range (e.g., if you select 7 days, “last period” means 8–14 days ago).
* **Export:** Each card includes a download option for CSV export. Reports include detailed fields such as appointment IDs and patient contact information to enable effective follow-up.
**Note:** Clicking on a card opens a detailed table. For example, the **Underscheduled Patients** card displays patient IDs, names, Plan of Care details, and progress percentages. Each patient ID links directly to the patient’s EHR profile for quick action.
| **Card** | **Description** |
| :---------------------------------- | :----------------------------------------------------------------------------------------------------------- |
| **Active Patients** | Number of patients with an open case (not archived or discharged). |
| **Scheduled Patients** | Patients with an open case and at least one future appointment scheduled. |
| **Dropped Patients** | Patients with an open case but no future appointments scheduled. |
| **Underscheduled Patients** | Patients with fewer completed/checked-in visits than expected in their Plan of Care (scheduling ratio \< 1). |
| **Average POC Allocation** | The average scheduling ratio across all patients with a valid Plan of Care. |
| **Discharges** | Patients discharged with their case closed during the selected timeframe. |
| **Visits per Discharge** | Average number of visits completed before discharge per case. |
| **Unsigned Notes** | Total number of unsigned notes, plus count of notes signed during the selected period. |
| **Arrival Rate** | Percentage of past appointments that were completed, checked in, confirmed, or ongoing. |
| **No Show Rate** | Percentage of past appointments marked as “No Show.” |
| **Cancellation Rate** | Percentage of past appointments that were cancelled. |
| **Patient Buy-In** | Measures patient engagement as the inverse of no-show rate (higher is better). |
| **Provider Efficiency** | Completed/checked-in appointments compared to a benchmark (80 per week per provider, configurable). |
| **Appointment Count** | Total number of appointments, filterable by status (default = Scheduled). |
| **Average Frequency of Visit** | Average visits per patient per week, using a 4-week rolling average of active patients. |
| **Initial Evaluations Scheduled** | Number of scheduled or completed appointments of the “Initial Evaluation” type. |
| **Average Initial Evals Scheduled** | Average weekly initial evaluation count over the selected date range. |
| **Average Appointment Count** | Average weekly appointment count over the selected date range. |
| **Average Units per Encounter** | Average number of billable units per encounter, based on the latest submitted claims. |
### **Understanding KPI Calculations**
**How it's calculated:**
* Counts distinct patients who have at least one non-archived case
* A case is considered "open" when **is\_archived = FALSE**
* The query joins **Appointments → Patient → AppointmentsCase**
* Filters by site, provider, and facility if specified
**When calculating 4-week average:**
* Groups patients by week
* Averages the patient counts across the 4-week period
**Note:** This metric is based on case status rather than date range, so it may not respect date filters.
**How it's calculated:**
* Identifies patients with open cases who have at least one future scheduled appointment
* Only counts appointments with status **'SCHEDULED'** or **'CONFIRMED'**
* Uses a CTE (Common Table Expression) to find the next appointment date for each patient
* Appointment must be in the future (after current timestamp in site timezone)
**Details included:**
* Patient count
* Next appointment date for each patient
**Note:** This metric is based on case status rather than date range, so it may not respect date filters.
**How it's calculated:**
* Identifies patients with open cases but **NO** future scheduled appointments
* Joins with latest evaluation chart note to pull Plan of Care (POC) information
* Calculates scheduling ratio based on POC parameters
**Details included:**
* Patient count
* Last completed appointment date for context
* Average POC allocation percentage as secondary statistic
**Note:** This helps you identify patients at risk of dropping out of treatment who need follow-up scheduling.
**How it's calculated:**
* Counts patients with scheduling ratio \< 1.0 (not fully scheduled according to POC)
* **Scheduling ratio** = (completed + upcoming appointments) / total POC visits
* Uses the latest evaluation or recertification note for POC data
* Only counts appointments within the POC date range
**POC visits calculation:**
* Calculated from frequency, duration, and visit count fields in the chart note
* Example: 3 visits/week × 4 weeks = 12 total POC visits
**Secondary statistics:**
* Shows average scheduling ratio across all patients as tertiary statistic
**Note:** This helps you identify patients who need more appointments scheduled to meet their treatment plan.
**How it's calculated:**
* Counts patients whose cases were archived (discharged) within the date range
* Uses **appointment\_case\_records** to find the exact discharge timestamp
* Adjusts timestamp to site timezone for accurate date filtering
* Only includes cases with discharge records (**is\_archived = TRUE**)
**Comparison:**
* Compares current period vs previous period for trend analysis
* Previous period duration matches current period duration
**Note:** This metric respects the date range filter.
**How it's calculated:**
* Calculates the average number of visits before discharge per case
* Only counts visits from appointments with valid statuses (excludes cancelled, archived)
* Filters visits to those occurring within the specified date range
* Groups by provider to show per-provider breakdown
**Calculation formula:**
* **Visits per Discharge** = Total visits / Total discharges
* Overall average calculated across all providers and discharges
**Note:** Higher numbers indicate longer treatment episodes before discharge.
**How it's calculated:**
* Counts currently unsigned chart notes (any date)
* Counts signed notes in the current period for context
* Excludes documentation-only notes
**Comparison:**
* Compares with previous period signed count
* Previous period duration matches current period duration
**Note:** The unsigned notes count is not filtered by date range - it shows all unsigned notes across all time periods.
**How they're calculated:**
* **Arrival Rate:** % of past appointments that were completed/checked-in/confirmed/ongoing
* **No Show Rate:** % of past appointments marked as no-show
* **Cancellation Rate:** % of past appointments cancelled
**Key details:**
* Only includes **past** appointments (excludes future scheduled and archived)
* All three rates sum to 100% of past appointments
* Compares current period vs previous period for trends
**Formula:**
* Each rate = (Count of appointments with specific status / Total past appointments) × 100
**How it's calculated:**
* Measures patient engagement as the inverse of no-show rate
* **Buy-in appointments:** scheduled, confirmed, completed, checked-in, ongoing, cancelled
* **Non-buy-in:** no-shows only
* Excludes archived appointments
**Interpretation:**
* Higher is better (indicates more patient engagement)
* Essentially shows what percentage of patients are engaged vs no-showing
**Comparison:**
* Compares current period vs previous period
**How it's calculated:**
* Measures provider productivity against a benchmark (default: 80 appointments/week)
* **Efficiency** = (completed+checked-in+ongoing+confirmed appts / benchmark) × 100
* Benchmark is adjusted for the actual number of weekdays in the date range
* Only counts appointments with completion statuses
**Configuration:**
* Configurable benchmark per site via **kpi\_config** table
* Default benchmark: 80 appointments per week per provider
**Display:**
* Shows per-provider breakdown with overall average
**How it's calculated:**
* Counts total appointments matching filter criteria
* Filterable by appointment status (scheduled, confirmed, completed, etc.)
* Excludes archived appointments
**Weekly average option:**
* Supports weekly average calculation when requested
* Total appointments divided by number of weeks in date range
**Note:** The appointment status filter is available directly on the card.
**How it's calculated:**
* Calculates average weekly appointment count over the date range
* Uses same filters as Appointment Count (status, category)
* **Formula:** Total appointments / Number of weeks in date range
**Purpose:**
* Helps normalize comparison across different time periods
* Useful for understanding typical weekly volume
**How it's calculated:**
* Measures average visits per patient per week
* **Numerator:** Total appointments in the selected week
* **Denominator:** 4-week rolling average of active patients
* Uses active patients (open cases) to normalize
**Purpose:**
* Helps understand patient visit cadence
* Shows how often active patients are being seen
**Comparison:**
* Compares with previous week
**How it's calculated:**
* Counts appointments of type **"Initial Evaluation"**
* Excludes archived, cancelled, and no-show appointments
* Uses **ehr\_appointment\_types** to identify initial eval appointments
* Supports weekly average calculation
**Comparison:**
* Compares current period vs previous period
**Note:** This helps track new patient intake rate.
**How it's calculated:**
* Calculates average weekly initial evaluation count
* Same filters and logic as Initial Evals Scheduled
* **Formula:** Total count / Number of weeks in date range
**Purpose:**
* Helps track new patient intake rate over time
* Normalizes comparison across different time periods
**How it's calculated:**
* Calculates average number of billable units per encounter
* Uses service unit count from the latest submitted claim (not ghost claims)
* Falls back to procedure's **service\_unit\_count** if no claim exists
* Only counts submitted claims (not pending or rejected)
**Data source priority:**
* Prioritizes lowest destination claim (PRIMARY over SECONDARY)
* Groups by encounter to get total units
* Averages across all encounters
**Comparison:**
* Compares current period vs previous period
**Note:** This helps track billing efficiency and documentation completeness.
**How it's calculated:**
* The average scheduling ratio across all patients with a valid Plan of Care
* **Scheduling ratio** = (completed + upcoming appointments) / total POC visits
* Uses the latest evaluation or recertification note for POC data
* Only includes patients with active cases and valid POC information
**Purpose:**
* Shows overall scheduling compliance across your practice
* Values closer to 1.0 indicate better adherence to treatment plans
### **Review the status of Active Patients**
Access the Active Patient Breakdown in **Insights → Performance Analysis** on the left navigation bar.
* **Definition:** An Active patient is any patient with an open case during the defined data range. You can see the % of patients with 0, 1, 2 and 3+ scheduled visits in the future.
* **Filters:** Apply filters by Date Range, Facility, and Provider.
* **Export:** You can download the top 4 cards for a CSV export. Reports include detailed fields from the table below including Patient name, Case, Provider, Insurance, # visits, Drop Offs, % Arrival, Last Appt., Appts Next week, Appts Following week and Notes.
### FAQ
**"Last period"** refers to the previous interval equal to your selected date range. For example:
* If you select **7 days** (today through 7 days ago), "last period" means **8-14 days ago**
* If you select **30 days**, "last period" means the **previous 30 days** before that
* If you select a custom range like **January 1-15**, "last period" means **December 17-31** (the same number of days)
This allows you to compare performance trends over equivalent time periods and identify improvements or areas needing attention.
Some metrics are based on **current case status** rather than date ranges:
* **Active Patients:** Shows patients with currently open cases (not archived), regardless of date
* **Scheduled Patients:** Shows patients with future appointments, regardless of date
* **Dropped Patients:** Shows patients without future appointments, regardless of date
These metrics give you a real-time snapshot of your current patient population. Most other cards, including **Discharges**, **Arrival Rate**, **Provider Efficiency**, and **Appointment Count**, do respect the date range filter.
**Note:** The **Unsigned Notes** card shows all unsigned notes (any date) but also displays how many notes were signed during the selected period for context.
The **scheduling ratio** helps you understand if patients are scheduled according to their Plan of Care (POC):
**Formula:**
* Scheduling Ratio = (Completed appointments + Upcoming appointments) / Total POC visits
**Example:**
* A patient's POC prescribes **3 visits per week for 4 weeks** = 12 total visits
* They've completed **5 visits** and have **4 more scheduled** = 9 total
* Scheduling ratio = 9 / 12 = **0.75 (or 75%)**
**Underscheduled patients** have a ratio **\< 1.0**, meaning they need more appointments to meet their treatment plan. This helps you proactively schedule patients before they fall behind.
**Provider Efficiency** measures productivity against a specific benchmark:
* **Default benchmark:** 80 completed appointments per week per provider (configurable by site)
* **Calculation:** (Completed + checked-in + ongoing + confirmed appointments / benchmark) × 100
* **Adjustment:** The benchmark is adjusted for the actual number of weekdays in your selected date range
**Other appointment metrics:**
* **Appointment Count:** Simply counts total appointments (filterable by status)
* **Average Appointment Count:** Weekly average across the date range
* **Average Frequency of Visit:** Visits per patient per week
Provider Efficiency is specifically designed to help you understand if providers are meeting productivity targets, while other metrics focus on volume or patient visit patterns.
Here are some practical ways to use these metrics:
**Reduce patient dropout:**
* Monitor **Dropped Patients** and **Underscheduled Patients** to proactively reach out and schedule appointments
* Track **Patient Buy-In** to identify engagement trends
**Optimize scheduling:**
* Use **Scheduling Ratio** and **Average POC Allocation** to ensure patients meet their treatment plans
* Review **Average Frequency of Visit** to understand typical visit patterns
**Improve attendance:**
* Monitor **Arrival Rate** and **No Show Rate** to identify trends
* Follow up with patients who have low arrival rates
**Track documentation:**
* Review **Unsigned Notes** daily to ensure timely chart completion
* Monitor **Average Units per Encounter** to track billing documentation
**Manage provider productivity:**
* Use **Provider Efficiency** to identify providers who may need support or are exceeding targets
* Compare **Visits per Discharge** across providers to understand treatment episode lengths
* **Definitions:** Hover over the info icon on any card to see a definition of the metric.
* **Filters:** Apply filters by Date Range, Facility, and Provider. Most cards, tables, and downloads respect these filters
* Exceptions include Active, Scheduled, and Dropped Patients (which are based on case status rather than date).
* Appointment Total cards include their own dropdown filters, allowing you to quickly view appointment metrics by status.
* **Trends:** Each card highlights current values with a “last period” comparison to indicate positive or negative changes. *“Last Period”* refers to the previous interval equal to the selected date range (e.g., if you select 7 days, “last period” means 8–14 days ago).
* **Export:** Each card includes a download option for CSV export. Reports include detailed fields such as appointment IDs and patient contact information to enable effective follow-up.
**Note:** Clicking on a card opens a detailed table. For example, the **Underscheduled Patients** card displays patient IDs, names, Plan of Care details, and progress percentages. Each patient ID links directly to the patient’s EHR profile for quick action.
| **Card** | **Description** |
| :---------------------------------- | :----------------------------------------------------------------------------------------------------------- |
| **Active Patients** | Number of patients with an open case (not archived or discharged). |
| **Scheduled Patients** | Patients with an open case and at least one future appointment scheduled. |
| **Dropped Patients** | Patients with an open case but no future appointments scheduled. |
| **Underscheduled Patients** | Patients with fewer completed/checked-in visits than expected in their Plan of Care (scheduling ratio \< 1). |
| **Average POC Allocation** | The average scheduling ratio across all patients with a valid Plan of Care. |
| **Discharges** | Patients discharged with their case closed during the selected timeframe. |
| **Visits per Discharge** | Average number of visits completed before discharge per case. |
| **Unsigned Notes** | Total number of unsigned notes, plus count of notes signed during the selected period. |
| **Arrival Rate** | Percentage of past appointments that were completed, checked in, confirmed, or ongoing. |
| **No Show Rate** | Percentage of past appointments marked as “No Show.” |
| **Cancellation Rate** | Percentage of past appointments that were cancelled. |
| **Patient Buy-In** | Measures patient engagement as the inverse of no-show rate (higher is better). |
| **Provider Efficiency** | Completed/checked-in appointments compared to a benchmark (80 per week per provider, configurable). |
| **Appointment Count** | Total number of appointments, filterable by status (default = Scheduled). |
| **Average Frequency of Visit** | Average visits per patient per week, using a 4-week rolling average of active patients. |
| **Initial Evaluations Scheduled** | Number of scheduled or completed appointments of the “Initial Evaluation” type. |
| **Average Initial Evals Scheduled** | Average weekly initial evaluation count over the selected date range. |
| **Average Appointment Count** | Average weekly appointment count over the selected date range. |
| **Average Units per Encounter** | Average number of billable units per encounter, based on the latest submitted claims. |
### **Understanding KPI Calculations**
**How it's calculated:**
* Counts distinct patients who have at least one non-archived case
* A case is considered "open" when **is\_archived = FALSE**
* The query joins **Appointments → Patient → AppointmentsCase**
* Filters by site, provider, and facility if specified
**When calculating 4-week average:**
* Groups patients by week
* Averages the patient counts across the 4-week period
**Note:** This metric is based on case status rather than date range, so it may not respect date filters.
**How it's calculated:**
* Identifies patients with open cases who have at least one future scheduled appointment
* Only counts appointments with status **'SCHEDULED'** or **'CONFIRMED'**
* Uses a CTE (Common Table Expression) to find the next appointment date for each patient
* Appointment must be in the future (after current timestamp in site timezone)
**Details included:**
* Patient count
* Next appointment date for each patient
**Note:** This metric is based on case status rather than date range, so it may not respect date filters.
**How it's calculated:**
* Identifies patients with open cases but **NO** future scheduled appointments
* Joins with latest evaluation chart note to pull Plan of Care (POC) information
* Calculates scheduling ratio based on POC parameters
**Details included:**
* Patient count
* Last completed appointment date for context
* Average POC allocation percentage as secondary statistic
**Note:** This helps you identify patients at risk of dropping out of treatment who need follow-up scheduling.
**How it's calculated:**
* Counts patients with scheduling ratio \< 1.0 (not fully scheduled according to POC)
* **Scheduling ratio** = (completed + upcoming appointments) / total POC visits
* Uses the latest evaluation or recertification note for POC data
* Only counts appointments within the POC date range
**POC visits calculation:**
* Calculated from frequency, duration, and visit count fields in the chart note
* Example: 3 visits/week × 4 weeks = 12 total POC visits
**Secondary statistics:**
* Shows average scheduling ratio across all patients as tertiary statistic
**Note:** This helps you identify patients who need more appointments scheduled to meet their treatment plan.
**How it's calculated:**
* Counts patients whose cases were archived (discharged) within the date range
* Uses **appointment\_case\_records** to find the exact discharge timestamp
* Adjusts timestamp to site timezone for accurate date filtering
* Only includes cases with discharge records (**is\_archived = TRUE**)
**Comparison:**
* Compares current period vs previous period for trend analysis
* Previous period duration matches current period duration
**Note:** This metric respects the date range filter.
**How it's calculated:**
* Calculates the average number of visits before discharge per case
* Only counts visits from appointments with valid statuses (excludes cancelled, archived)
* Filters visits to those occurring within the specified date range
* Groups by provider to show per-provider breakdown
**Calculation formula:**
* **Visits per Discharge** = Total visits / Total discharges
* Overall average calculated across all providers and discharges
**Note:** Higher numbers indicate longer treatment episodes before discharge.
**How it's calculated:**
* Counts currently unsigned chart notes (any date)
* Counts signed notes in the current period for context
* Excludes documentation-only notes
**Comparison:**
* Compares with previous period signed count
* Previous period duration matches current period duration
**Note:** The unsigned notes count is not filtered by date range - it shows all unsigned notes across all time periods.
**How they're calculated:**
* **Arrival Rate:** % of past appointments that were completed/checked-in/confirmed/ongoing
* **No Show Rate:** % of past appointments marked as no-show
* **Cancellation Rate:** % of past appointments cancelled
**Key details:**
* Only includes **past** appointments (excludes future scheduled and archived)
* All three rates sum to 100% of past appointments
* Compares current period vs previous period for trends
**Formula:**
* Each rate = (Count of appointments with specific status / Total past appointments) × 100
**How it's calculated:**
* Measures patient engagement as the inverse of no-show rate
* **Buy-in appointments:** scheduled, confirmed, completed, checked-in, ongoing, cancelled
* **Non-buy-in:** no-shows only
* Excludes archived appointments
**Interpretation:**
* Higher is better (indicates more patient engagement)
* Essentially shows what percentage of patients are engaged vs no-showing
**Comparison:**
* Compares current period vs previous period
**How it's calculated:**
* Measures provider productivity against a benchmark (default: 80 appointments/week)
* **Efficiency** = (completed+checked-in+ongoing+confirmed appts / benchmark) × 100
* Benchmark is adjusted for the actual number of weekdays in the date range
* Only counts appointments with completion statuses
**Configuration:**
* Configurable benchmark per site via **kpi\_config** table
* Default benchmark: 80 appointments per week per provider
**Display:**
* Shows per-provider breakdown with overall average
**How it's calculated:**
* Counts total appointments matching filter criteria
* Filterable by appointment status (scheduled, confirmed, completed, etc.)
* Excludes archived appointments
**Weekly average option:**
* Supports weekly average calculation when requested
* Total appointments divided by number of weeks in date range
**Note:** The appointment status filter is available directly on the card.
**How it's calculated:**
* Calculates average weekly appointment count over the date range
* Uses same filters as Appointment Count (status, category)
* **Formula:** Total appointments / Number of weeks in date range
**Purpose:**
* Helps normalize comparison across different time periods
* Useful for understanding typical weekly volume
**How it's calculated:**
* Measures average visits per patient per week
* **Numerator:** Total appointments in the selected week
* **Denominator:** 4-week rolling average of active patients
* Uses active patients (open cases) to normalize
**Purpose:**
* Helps understand patient visit cadence
* Shows how often active patients are being seen
**Comparison:**
* Compares with previous week
**How it's calculated:**
* Counts appointments of type **"Initial Evaluation"**
* Excludes archived, cancelled, and no-show appointments
* Uses **ehr\_appointment\_types** to identify initial eval appointments
* Supports weekly average calculation
**Comparison:**
* Compares current period vs previous period
**Note:** This helps track new patient intake rate.
**How it's calculated:**
* Calculates average weekly initial evaluation count
* Same filters and logic as Initial Evals Scheduled
* **Formula:** Total count / Number of weeks in date range
**Purpose:**
* Helps track new patient intake rate over time
* Normalizes comparison across different time periods
**How it's calculated:**
* Calculates average number of billable units per encounter
* Uses service unit count from the latest submitted claim (not ghost claims)
* Falls back to procedure's **service\_unit\_count** if no claim exists
* Only counts submitted claims (not pending or rejected)
**Data source priority:**
* Prioritizes lowest destination claim (PRIMARY over SECONDARY)
* Groups by encounter to get total units
* Averages across all encounters
**Comparison:**
* Compares current period vs previous period
**Note:** This helps track billing efficiency and documentation completeness.
**How it's calculated:**
* The average scheduling ratio across all patients with a valid Plan of Care
* **Scheduling ratio** = (completed + upcoming appointments) / total POC visits
* Uses the latest evaluation or recertification note for POC data
* Only includes patients with active cases and valid POC information
**Purpose:**
* Shows overall scheduling compliance across your practice
* Values closer to 1.0 indicate better adherence to treatment plans
### **Review the status of Active Patients**
Access the Active Patient Breakdown in **Insights → Performance Analysis** on the left navigation bar.
* **Definition:** An Active patient is any patient with an open case during the defined data range. You can see the % of patients with 0, 1, 2 and 3+ scheduled visits in the future.
* **Filters:** Apply filters by Date Range, Facility, and Provider.
* **Export:** You can download the top 4 cards for a CSV export. Reports include detailed fields from the table below including Patient name, Case, Provider, Insurance, # visits, Drop Offs, % Arrival, Last Appt., Appts Next week, Appts Following week and Notes.
### FAQ
**"Last period"** refers to the previous interval equal to your selected date range. For example:
* If you select **7 days** (today through 7 days ago), "last period" means **8-14 days ago**
* If you select **30 days**, "last period" means the **previous 30 days** before that
* If you select a custom range like **January 1-15**, "last period" means **December 17-31** (the same number of days)
This allows you to compare performance trends over equivalent time periods and identify improvements or areas needing attention.
Some metrics are based on **current case status** rather than date ranges:
* **Active Patients:** Shows patients with currently open cases (not archived), regardless of date
* **Scheduled Patients:** Shows patients with future appointments, regardless of date
* **Dropped Patients:** Shows patients without future appointments, regardless of date
These metrics give you a real-time snapshot of your current patient population. Most other cards, including **Discharges**, **Arrival Rate**, **Provider Efficiency**, and **Appointment Count**, do respect the date range filter.
**Note:** The **Unsigned Notes** card shows all unsigned notes (any date) but also displays how many notes were signed during the selected period for context.
The **scheduling ratio** helps you understand if patients are scheduled according to their Plan of Care (POC):
**Formula:**
* Scheduling Ratio = (Completed appointments + Upcoming appointments) / Total POC visits
**Example:**
* A patient's POC prescribes **3 visits per week for 4 weeks** = 12 total visits
* They've completed **5 visits** and have **4 more scheduled** = 9 total
* Scheduling ratio = 9 / 12 = **0.75 (or 75%)**
**Underscheduled patients** have a ratio **\< 1.0**, meaning they need more appointments to meet their treatment plan. This helps you proactively schedule patients before they fall behind.
**Provider Efficiency** measures productivity against a specific benchmark:
* **Default benchmark:** 80 completed appointments per week per provider (configurable by site)
* **Calculation:** (Completed + checked-in + ongoing + confirmed appointments / benchmark) × 100
* **Adjustment:** The benchmark is adjusted for the actual number of weekdays in your selected date range
**Other appointment metrics:**
* **Appointment Count:** Simply counts total appointments (filterable by status)
* **Average Appointment Count:** Weekly average across the date range
* **Average Frequency of Visit:** Visits per patient per week
Provider Efficiency is specifically designed to help you understand if providers are meeting productivity targets, while other metrics focus on volume or patient visit patterns.
Here are some practical ways to use these metrics:
**Reduce patient dropout:**
* Monitor **Dropped Patients** and **Underscheduled Patients** to proactively reach out and schedule appointments
* Track **Patient Buy-In** to identify engagement trends
**Optimize scheduling:**
* Use **Scheduling Ratio** and **Average POC Allocation** to ensure patients meet their treatment plans
* Review **Average Frequency of Visit** to understand typical visit patterns
**Improve attendance:**
* Monitor **Arrival Rate** and **No Show Rate** to identify trends
* Follow up with patients who have low arrival rates
**Track documentation:**
* Review **Unsigned Notes** daily to ensure timely chart completion
* Monitor **Average Units per Encounter** to track billing documentation
**Manage provider productivity:**
* Use **Provider Efficiency** to identify providers who may need support or are exceeding targets
* Compare **Visits per Discharge** across providers to understand treatment episode lengths